ChartCool
在线图表制作工具
首页
我的
'
'
组合图
'
'
线图
'
'
柱形图
'
'
饼图
'
'
散点图
'
'
统计地图
'
'
雷达图
'
'
热力图
'
'
矩形树图
'
'
旭日图
'
'
平行坐标
'
'
桑基图
'
'
漏斗图
'
'
词云图
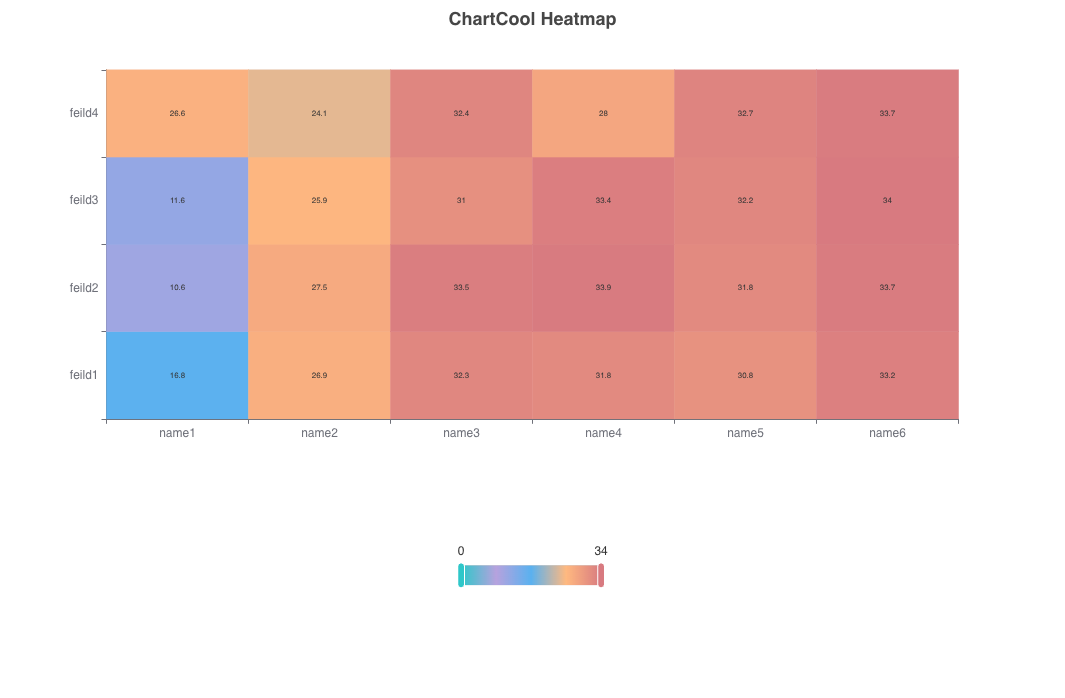
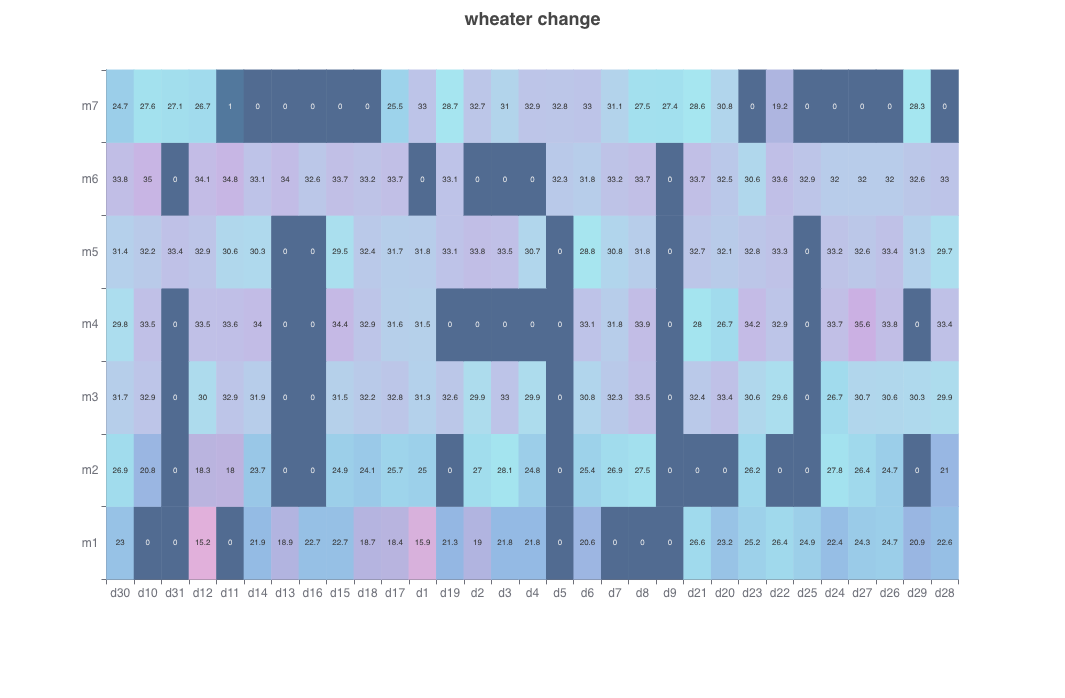
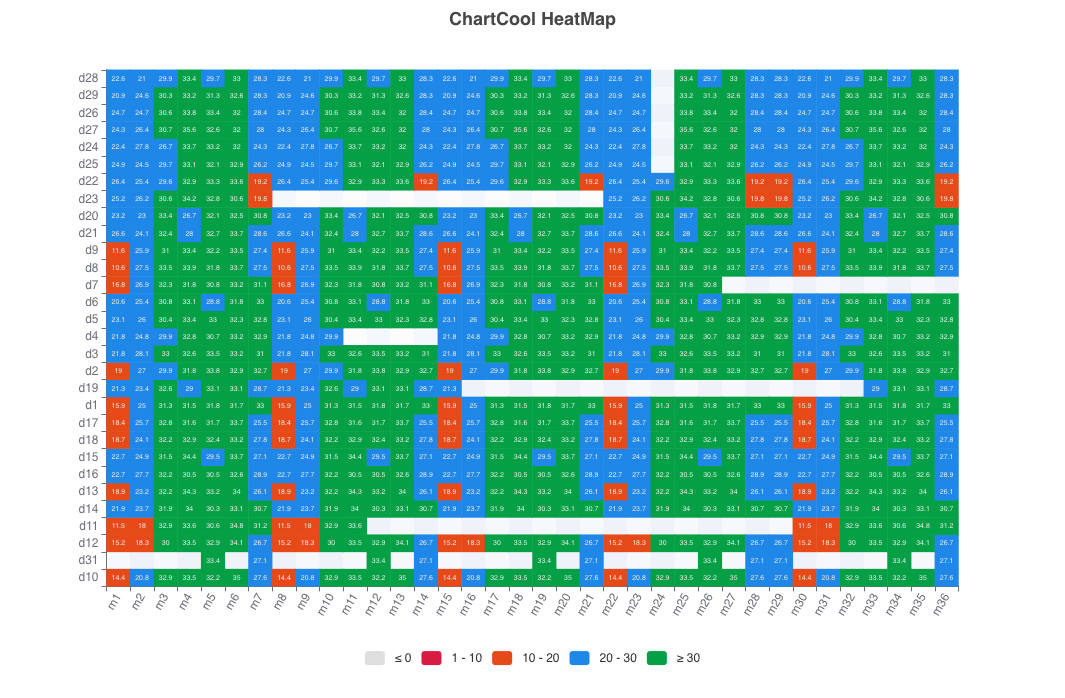
热力图
热力图是一种通过对色块着色来显示数据的统计图表。绘图时,需指定颜色映射的规则,例如,较大的值由较深的颜色表示,较小的值由较浅的颜色表示等等
基础热力图
查看
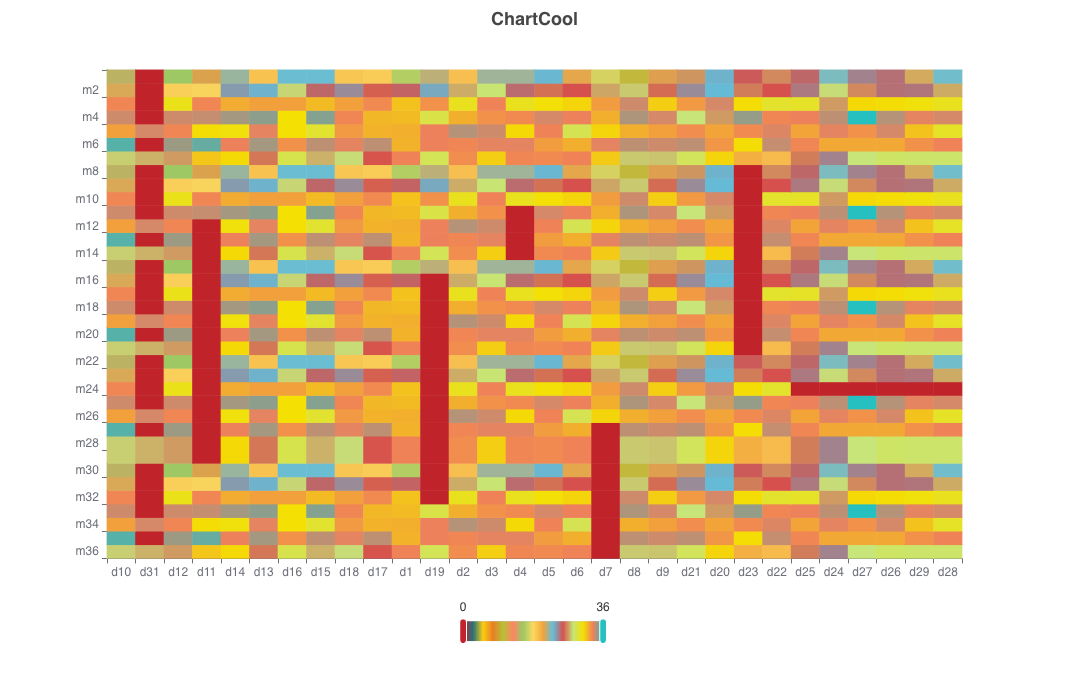
多行多列的热力图
查看
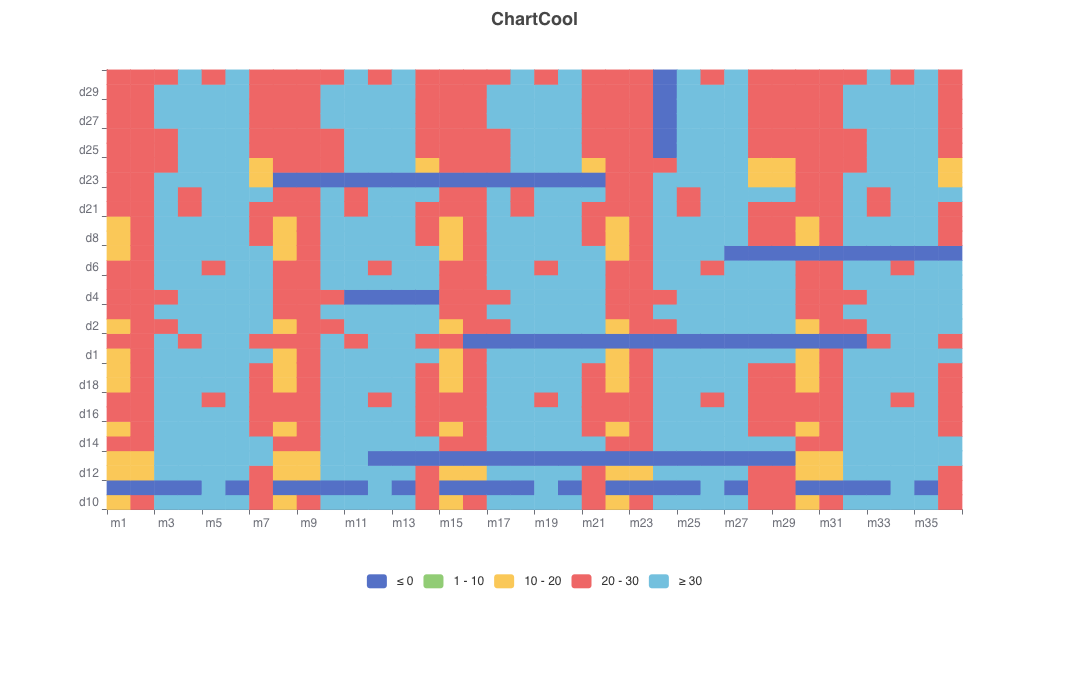
多行多列区间颜色的热力图
查看
多行多列不同主题的热力图
查看
无辅助器的热力图
查看
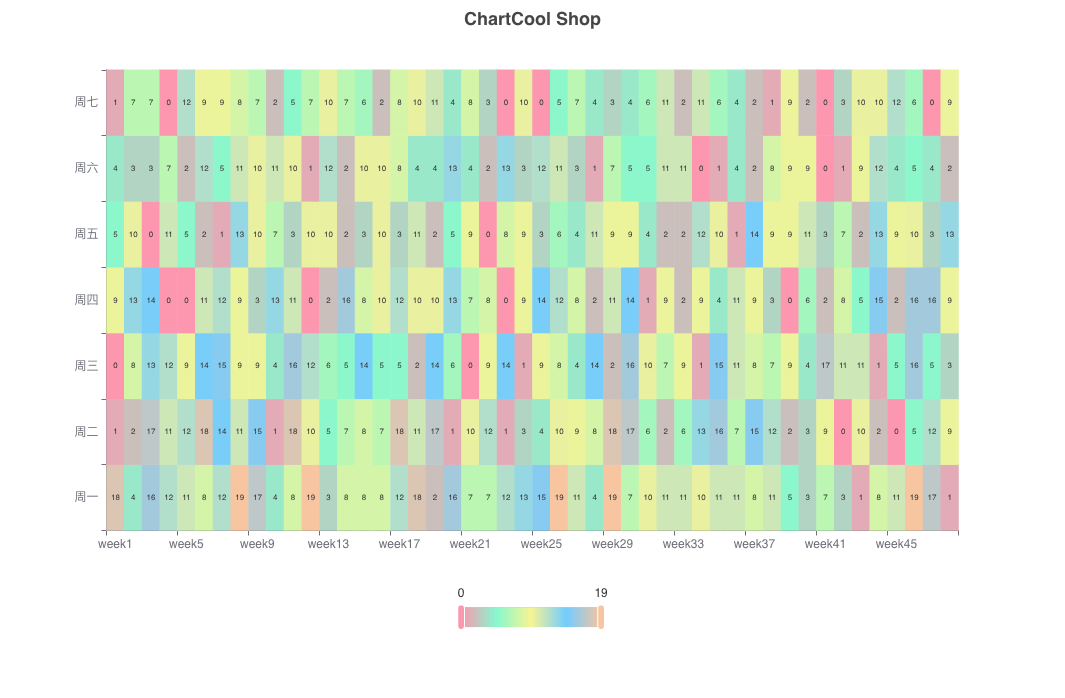
多行多列区间颜色带标签的热力图
查看