Map
Statistical map is a combination of statistical graphics and maps, which can highlight the geographical distribution of certain phenomena, compare certain phenomena between different regions, and indicate the geographic location of the phenomenon and its relationship with other relationship with natural conditions, etc.
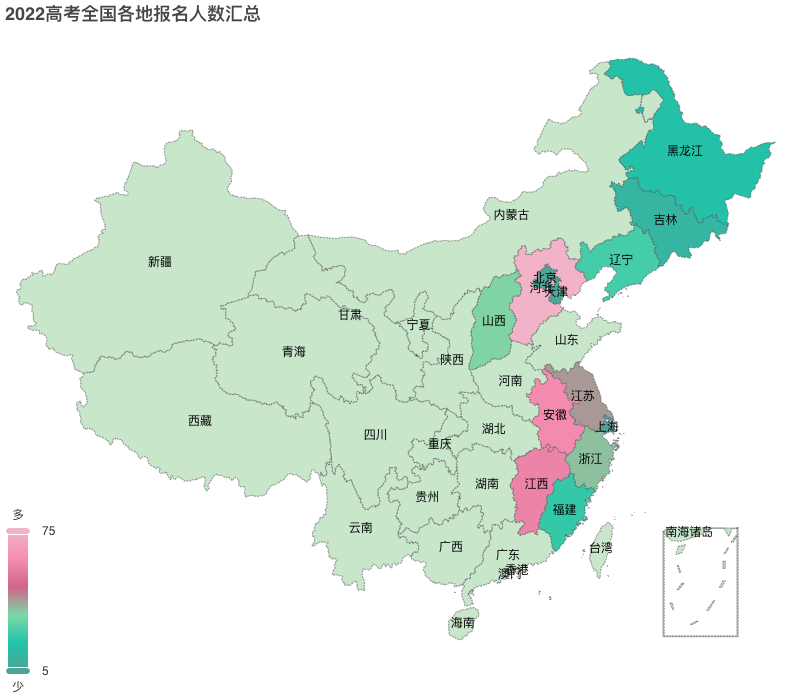
Statistical map of the number of people taking the college entrance examination in some regions in 2022See
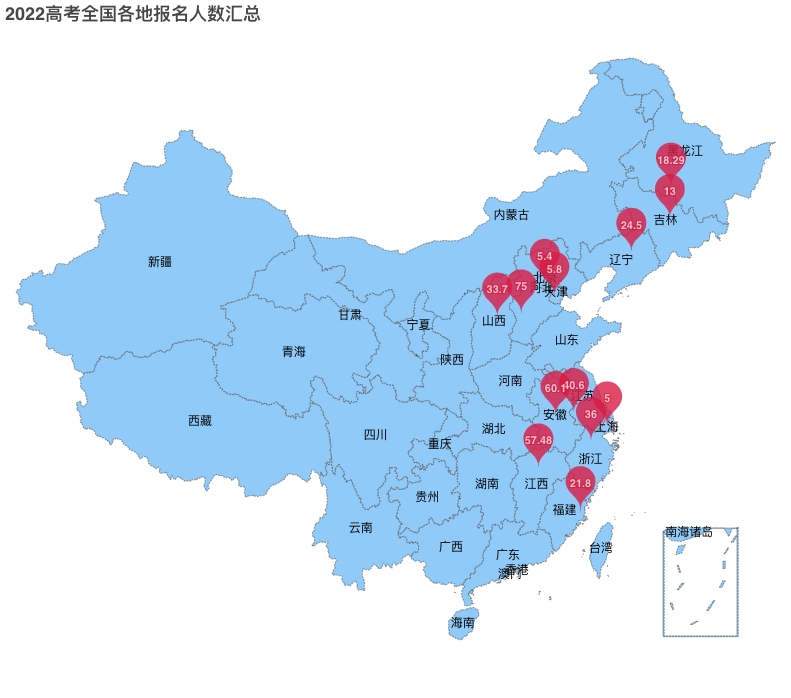
Marked statistical map of the number of people taking the college entrance examination in some regions in 2022See
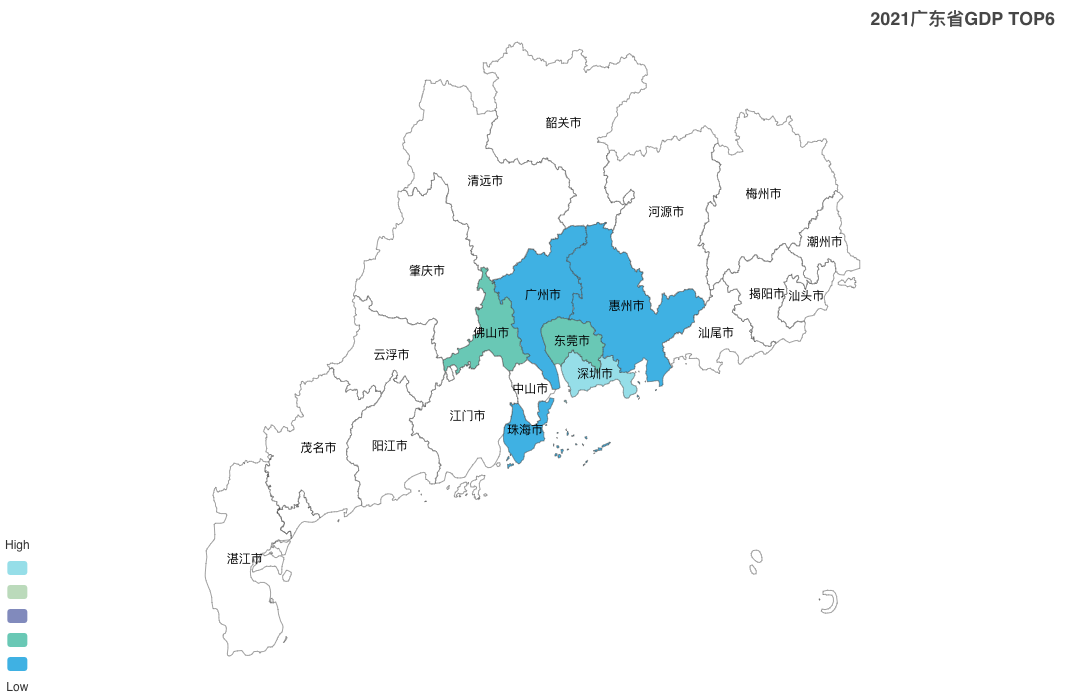
Statistical Map of Top 6 Cities in Guangdong Province in 2021See
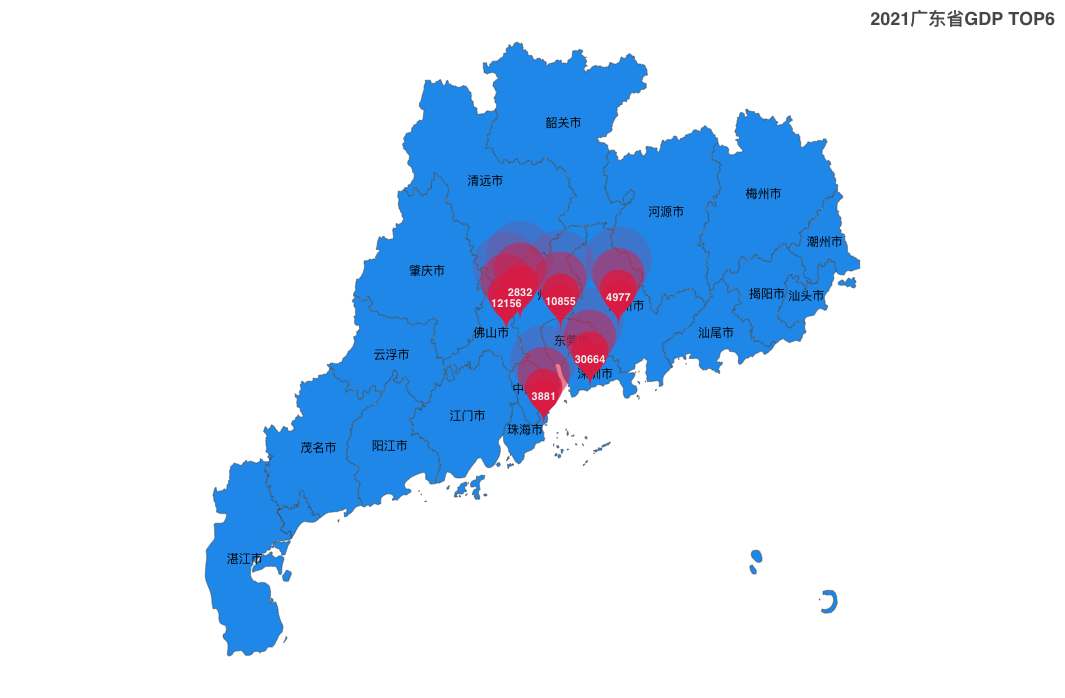
Marked Statistical Map of Top 6 Cities in Guangdong Province in 2021See
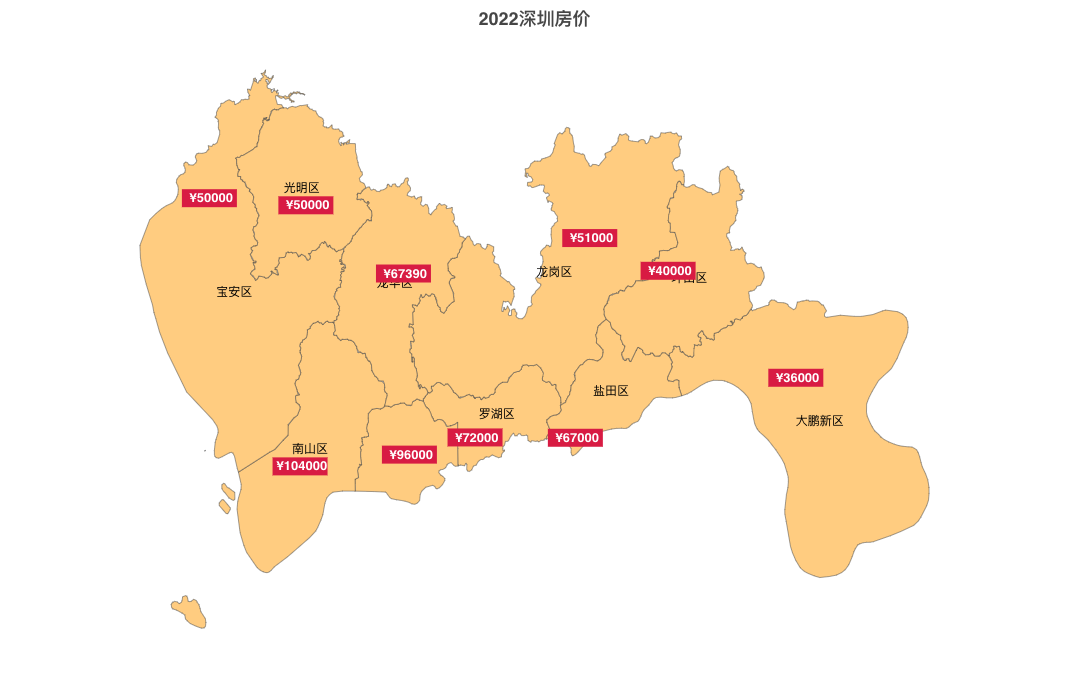
Statistics Map of Housing Prices in Shenenen in 2022See
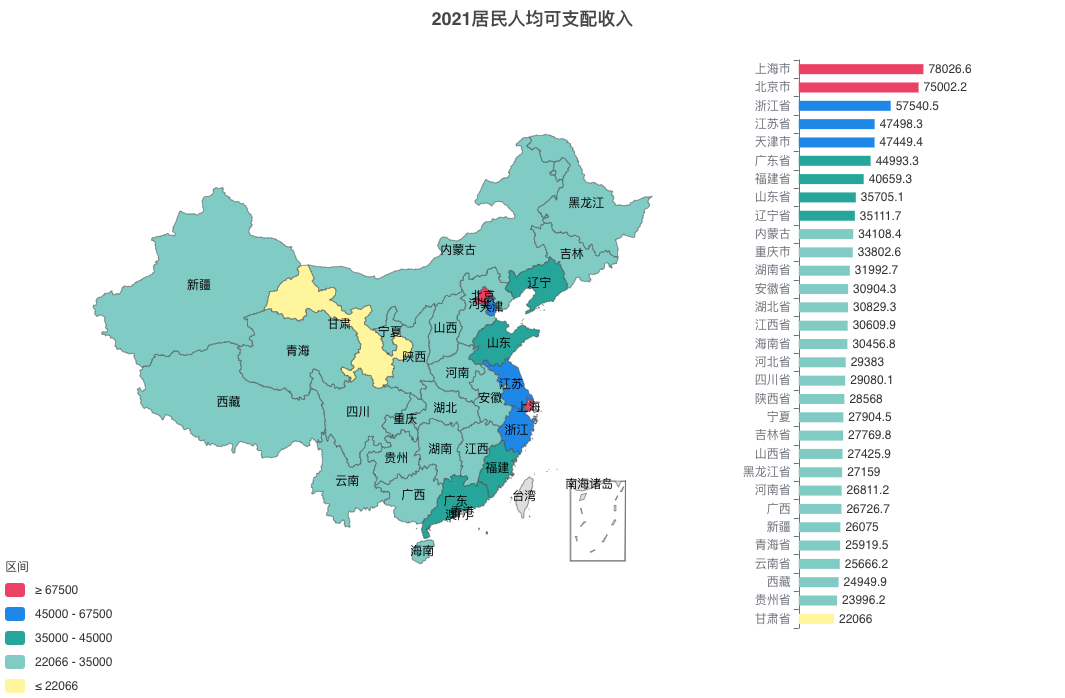
Statistical map combined with column chartSee
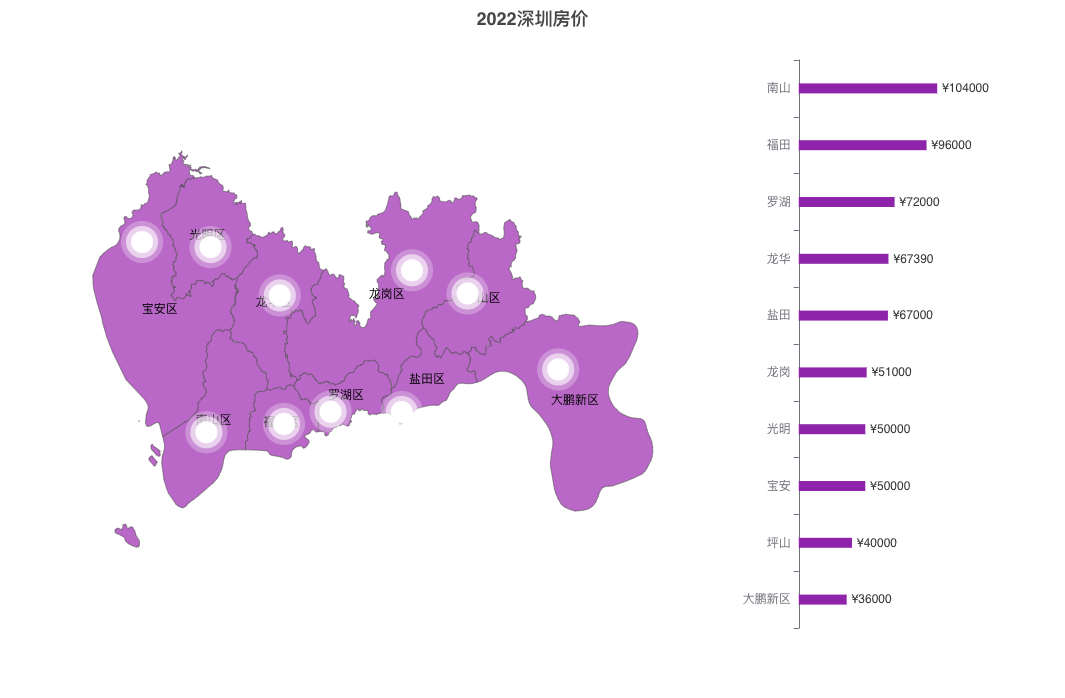
Statistical map combined with scatter and column chartsSee