Sunburst
The sunburst chart is a deformation of the pie chart. In short, it is an upgraded version of multiple pie charts. The pie chart can only show the proportion of one layer of data, while the sunburst chart can not only show the proportion of data , but also to clarify the relationship between multi-level data
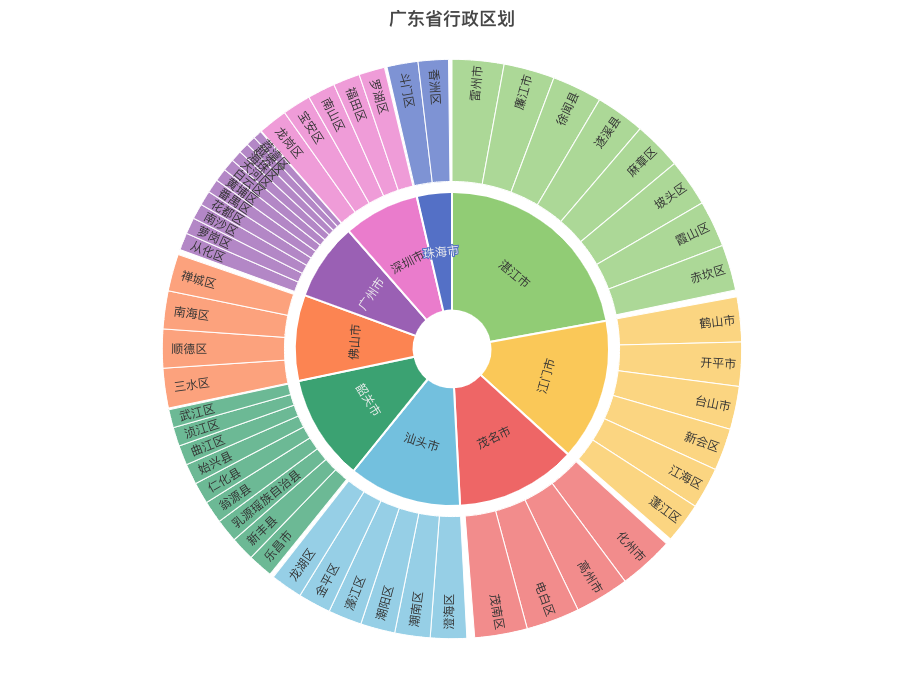
Sunrise Map of Guangdong ProvinceSee 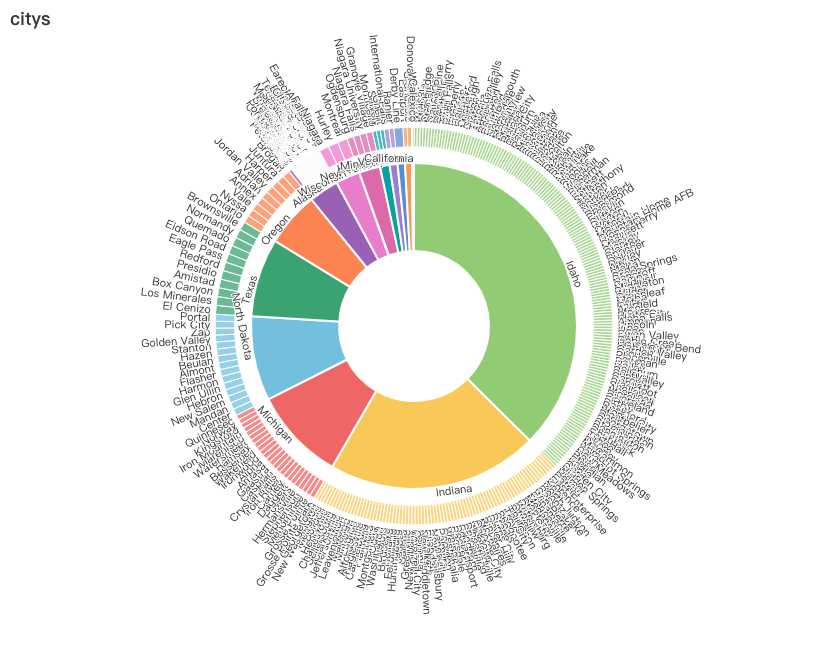
Sunrise Map of American States and CitiesSee 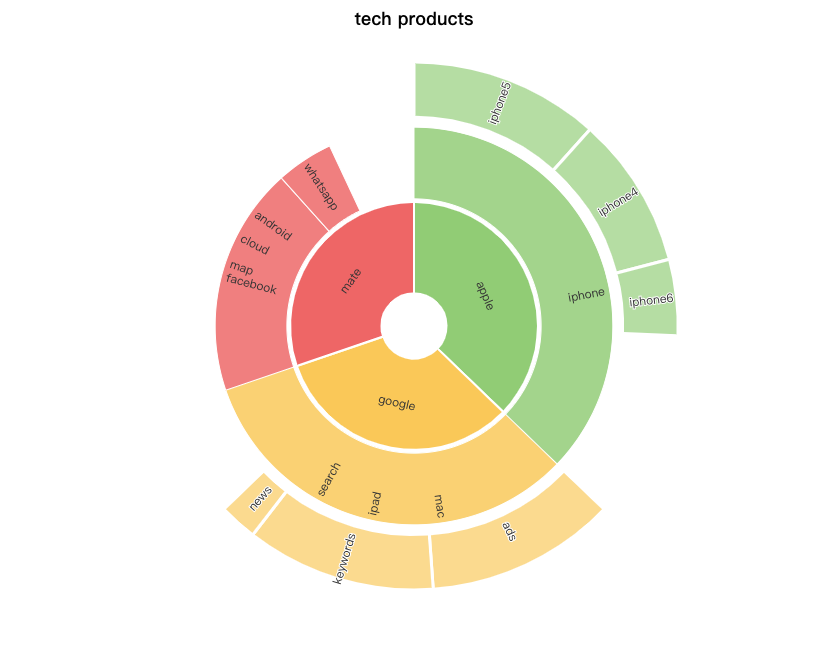
Sunrise chart of enterprises and productsSee 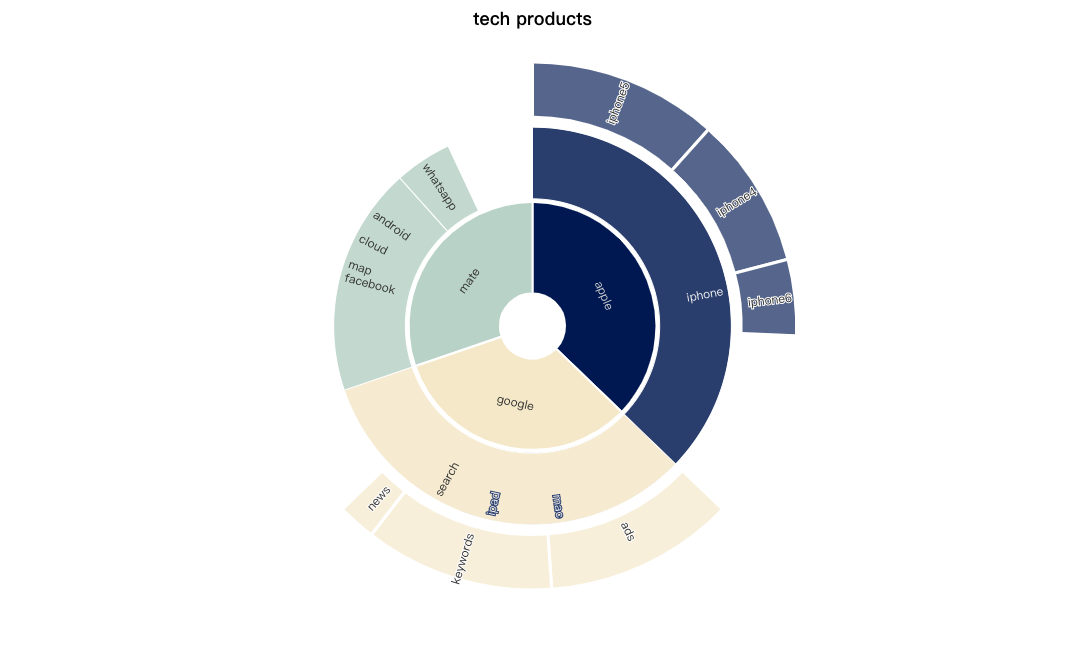
Sunburst of companies and products with different themesSee